

Last update: May 17, 2025
Google Data Studio, now known as Looker Studio (still having trouble getting used to that name change) is a great tool for building out data visualization dashboards from the simple to very complex. Today I’m going to show you a quick and easy Data Studio SEO Dashboard.
This dashboard complements other SEO strategies like following a comprehensive technical SEO checklist to ensure your site is performing at its best.
This SEO Dashboard is perfect for new sites, small businesses, or even large websites that need a quick data snapshot. Agencies can also use this as a value-add to a new website build, or just to keep tabs on SEO trends. Hold tight and I’ll walk you through the steps.
If you are already experienced in Data Studio and just want to grab a copy of the report, here is the Sample SEO Dashboard with Trends.
Components of the SEO Dash Board
Components to this dashboard are pretty simple. You need two datasources, both from Google’s Search Console (aka Google Webmaster Tools). Using the sample connections in Google Data Studio/Looker Studio, we are going to use:
- [sample] Search Console Data (Site)
- [sample] Search Console Data (URL)
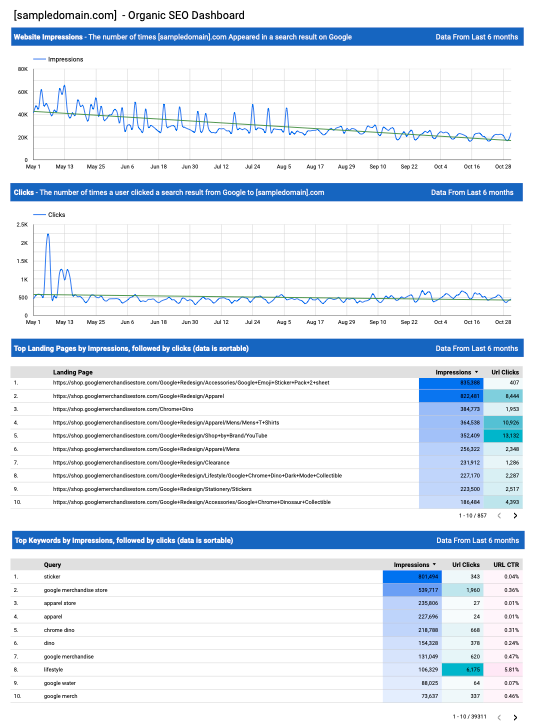
We are going to build out four sections for this report.
- Website Impressions
- Website Clicks
- Top Landing Pages (sortable by Impressions and URL Clicks)
- Top Keywords (sortable by Impressions, URL Clicks and URL CTR)
Website Impressions
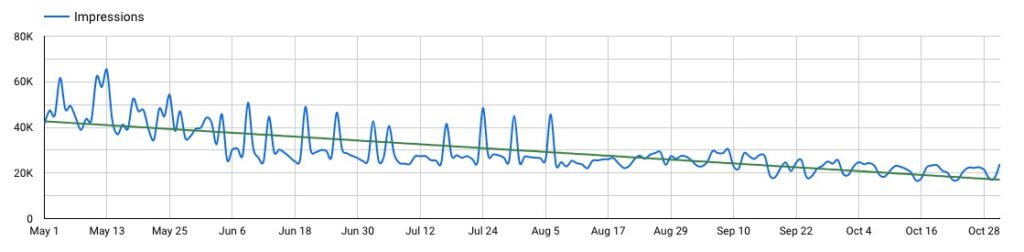
This component uses the Search Console Site Datasource. Here are the steps to create this chart:
- Start by clicking Add a Chart > Time Series (I used Time Series > Smoothed).
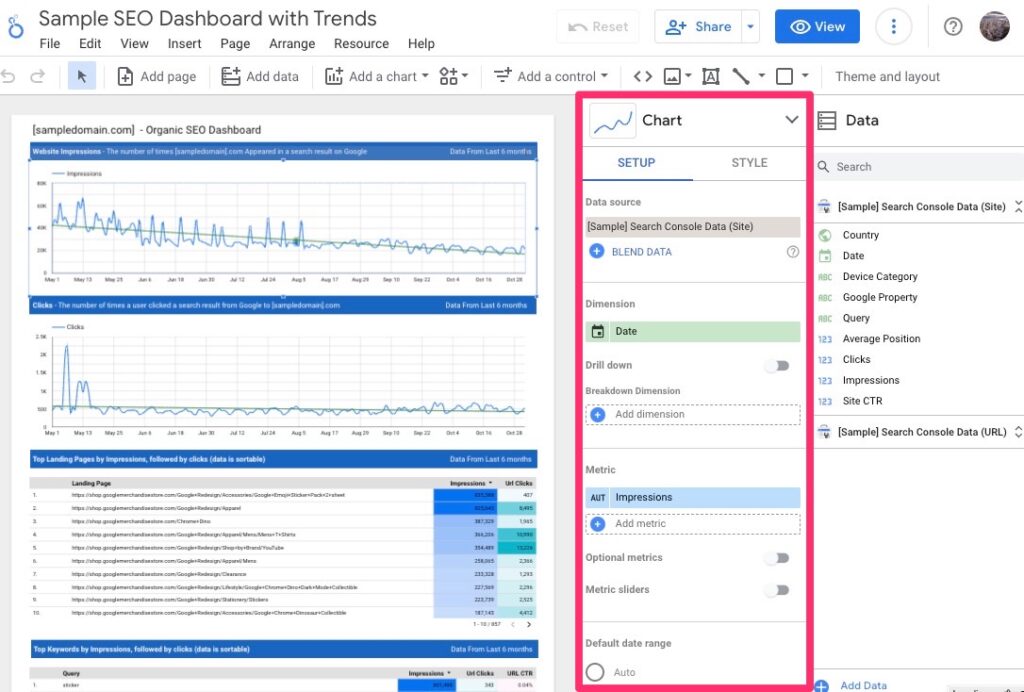
- In the Chart SETUP Panel , make sure you select your Search Console Site datasource.
- Set the Dimension to Date.
- Set your Metric to Impressions.
- Set your default date range.
In this report, I used the last six months of data, but you can use any of the predefined fields that fit your view. If you’d like to recreate the last six months as I did, select Advanced then in the Start Date, select Today, then Minus, then 6, then Months. You should see something similar to this:
- Finally, add the trend line. Toggle over to the Chart STYLE Panel. look for Trendline (should be the third option) and select Linear from the dropdown.
Website Clicks
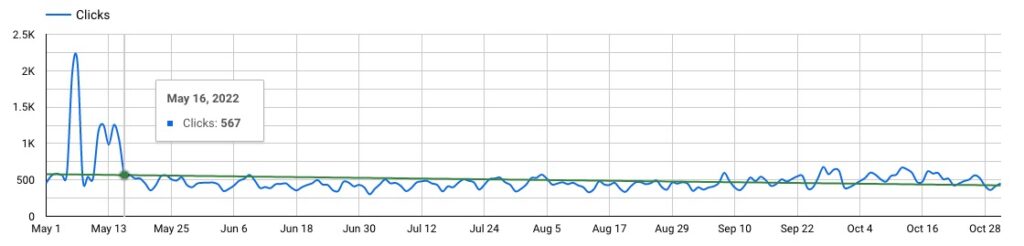
For the website Clicks, we are going to do the exact same thing except we will be using Clicks as the Metric instead of impressions. To save time, you can select the previous chart and then copy/paste. Edit your new chart to select Clicks instead of Impressions in the Chart SETUP Panel. This panel is the middle column when you are in edit mode:
SEO Dashboard: Top Landing Pages
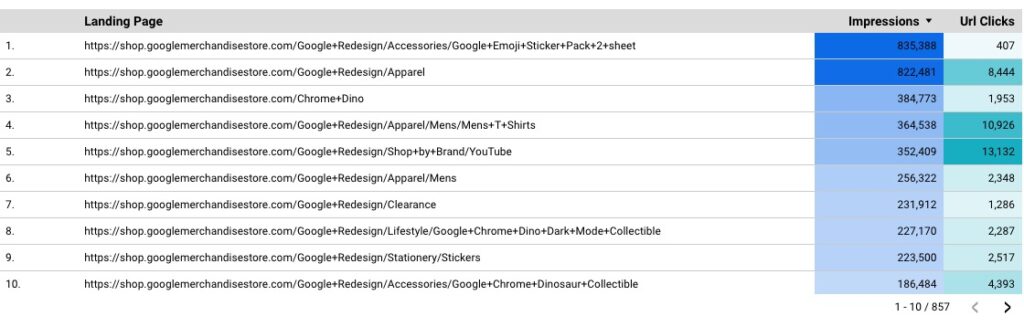
For this component, we are going to switch to the Search Console URL Datasource.
- Start by clicking Add a Chart > Table (I used the third option, Table with Heatmap).
- Head over to the Setup Panel and make sure the datasource is set to your Search Console URL datasource. Set your dimension as Landing Page.
- Set your first Metric as Impressions, click Add metric, and select URL Clicks.
- For this report, I set 10 rows per page and the default sorting to Impressions > Descending.
- Just like my other two charts thus far, we set the date to the last six months.
In the Chart > Style panel, I prefer to show the Show Header, Show Row Numbers and Show Pagination. Based on the size of this report and 10 rows per page, this will give you the navigation to move through different pages and dive into more landing page data.
SEO Dashboard: Top Keywords
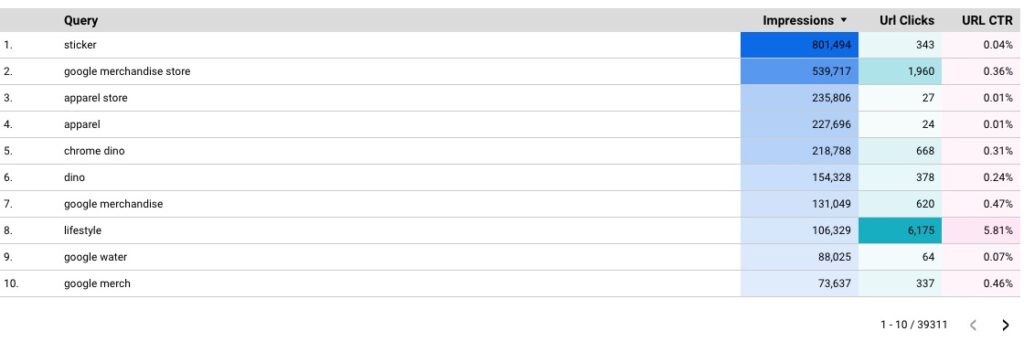
To create the Top keywords component, copy/paste the Top Landing Page component since it is using the same datasource and chart type. In the Chart Setup panel, set the dimension as Query. Then the Metrics as Impressions, URL Clicks and URL CTR. The Rows and Date Range should be set to 10 and the last six months as well.
For the styles, I kept the same the Landing Pages chart with Show Header, Show Row Numbers and Show Pagination.
Now the only thing left to do is arrange the report to your liking. Here is a link to the Sample SEO Dashboard with Trends if you want to play around with it, or Copy it and make it your own report. In the header, click the 3 dots icon and select Make a Copy. You will be prompted to update the datasources or you can copy it as is, and then update the datasources on your own by clicking to the Edit view, then Resource Menu > Manage Added Datasources.
That’s it for today. I hope you liked this report and can find a way to use it for yourself or your clients. If you liked this report, you may be interested in my Multiple Domain Monitoring Dashboard post.